Dust Samples from Lonnstrom Dinning Hall
A main food location in campus is Lonnstrom dinning hall. We obtained the dust sample from a side of the Pepsi machine (soda fountain) in the center of the dinning hall. We obtained two dust samples for analysis and as usual we did the analysis using the SEM.
The data we obtained from analysis is shown below;
The section of the dust sample 1 which we analyzed is shown above. The strings that can be seen are from the adhesive in the carbon tape. The particles are the dust that was obtained from the location
This is the image we obtain after 600 seconds of analyzing the sample in the SEM. Different colors represent different elements. This image is the map of elements that were found in dust sample along with the image of the dust sample.
This is the map of the element of the dust sample 1 without the image. We can compare the 2 images above to identify the dust samples from the picture without the image of the dust sample. The yellow dots represents Silicon which shows where the dust can be seen. The other elements such as Calcium which was found to be in other dust samples too, gives us a trace of dust particles
| Element | AN | series | [wt.%] | [norm. wt.%] | [norm. at.%] | Error in wt.% (1 Sigma) |
| Sodium | 11 | K-series | 0.26541465 | 3.867287581 | 5.300527512 | 0.045282686 |
| Magnesium | 12 | K-series | 0.047965902 | 0.698898633 | 0.906078481 | 0.028865888 |
| Aluminium | 13 | K-series | 1.151718548 | 16.78139029 | 19.59785117 | 0.083881415 |
| Silicon | 14 | K-series | 1.53860185 | 22.41856589 | 25.15202283 | 0.094718449 |
| Phosphorus | 15 | K-series | 0.403201942 | 5.874950233 | 5.976645737 | 0.042720741 |
| Sulfur | 16 | K-series | 0.507964331 | 7.40141566 | 7.273061456 | 0.045105424 |
| Chlorine | 17 | K-series | 1.254086487 | 18.27296681 | 16.24078438 | 0.069488987 |
| Potassium | 19 | K-series | 0.507541127 | 7.395249259 | 5.959944188 | 0.041929028 |
| Calcium | 20 | K-series | 1.186575075 | 17.28927565 | 13.59308425 | 0.061400767 |
| Sum: | 6.863069912 | 100 | 100 |
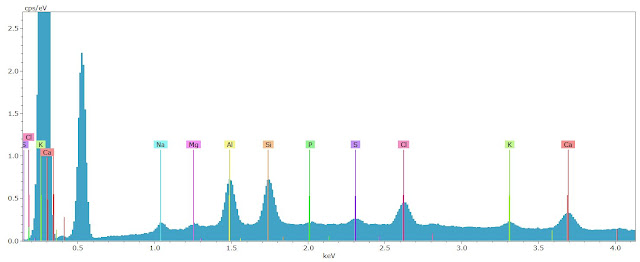
The data confirm a higher weight percentage of Silicon and Aluminium (22.4% and 16.8% respectively). We can also see a 17.3% and 18.2% of Calcium and Chlorine respectively. Silicon can be explained in terms of elements found in sand and dirt. Aluminium can be also found in the stage which we place the carbon tape with the dust. Hence there is a possibility that the Aluminium from the stage was detected. Calcium can be accumulated in the dust from dead skin or hair. Chlorine can expected in dust because cleaning supplies contains chlorine and the dust accumulates it from the surface.
The data from the dust sample 2 that was obtained from Lonnstrom is shown below.
Similar to the sample 1 a significant amount of Al, Si, Cl and Ca can be found.
The raw data for the sample 2:
| Element | AN | series | [wt.%] | [norm. wt.%] | [norm. at.%] | Error in wt.% (1 Sigma) |
| Sodium | 11 | K-series | 0.26541465 | 3.867287581 | 5.300527512 | 0.045282686 |
| Magnesium | 12 | K-series | 0.047965902 | 0.698898633 | 0.906078481 | 0.028865888 |
| Aluminium | 13 | K-series | 1.151718548 | 16.78139029 | 19.59785117 | 0.083881415 |
| Silicon | 14 | K-series | 1.53860185 | 22.41856589 | 25.15202283 | 0.094718449 |
| Phosphorus | 15 | K-series | 0.403201942 | 5.874950233 | 5.976645737 | 0.042720741 |
| Sulfur | 16 | K-series | 0.507964331 | 7.40141566 | 7.273061456 | 0.045105424 |
| Chlorine | 17 | K-series | 1.254086487 | 18.27296681 | 16.24078438 | 0.069488987 |
| Potassium | 19 | K-series | 0.507541127 | 7.395249259 | 5.959944188 | 0.041929028 |
| Calcium | 20 | K-series | 1.186575075 | 17.28927565 | 13.59308425 | 0.061400767 |
| Sum: | 6.863069912 | 100 | 100 |
Similar explanation to the sample 1 can be said about the sample 2 because the weight composition is very similar. Hence there is a possibility that we could identify a particular location by analyzing a dust sample, because there are only minor changes between the two different samples.
However it was interesting to find a different new element, Titanium in the map data, however this amount was significantly low to identify it when the data was quantified to get weight percentages.
Dust Samples from Casey's
Different from Lonnstrom but another major food location is Casey's in SSU. This is different because it is also a communal living space for commuters and residents. We obtained two different samples from the top of a Pepsi cooler and carried out the analysis to obtain the following data. Following is a video documentary of Brendan Waffle collecting the dust sample from the top of the cooler in Caseys;
Similar to the samples from Lonnstrom, for each of the samples analyzed, the image of the sample, the map of the elemental composition of the sample, the map of the elemental composition with the image of the sample, the spectrum of the elemental composition and the raw data of elemental composition of the sample are shown bellow respectively.
The data for sample 1 is shown below;
The raw data for the sample is shown below;
| Element | AN | series | [wt.%] | [norm. wt.%] | [norm. at.%] | Error in wt.% (1 Sigma) |
| Sodium | 11 | K-series | 1.082004327 | 6.213813936 | 8.723103264 | 0.101684091 |
| Magnesium | 12 | K-series | 0.619227153 | 3.556143185 | 4.722054647 | 0.062878258 |
| Aluminium | 13 | K-series | 1.938429692 | 11.13215644 | 13.31557613 | 0.123738713 |
| Silicon | 14 | K-series | 5.11022473 | 29.34737399 | 33.72364288 | 0.25360306 |
| Phosphorus | 15 | K-series | 0.566071695 | 3.250878113 | 3.387303826 | 0.049625789 |
| Sulfur | 16 | K-series | 0.733820986 | 4.214241065 | 4.241524516 | 0.053673022 |
| Chlorine | 17 | K-series | 2.041309061 | 11.72297964 | 10.67176098 | 0.096662882 |
| Potassium | 19 | K-series | 0.905289094 | 5.198960714 | 4.291469755 | 0.05417544 |
| Calcium | 20 | K-series | 2.050140536 | 11.77369768 | 9.481001909 | 0.086717616 |
| Titanium | 22 | K-series | 0.260271528 | 1.494706452 | 1.007509529 | 0.0337893 |
| Iron | 26 | K-series | 0.96104763 | 5.519174931 | 3.189493385 | 0.051321831 |
| Zinc | 30 | K-series | 1.145049408 | 6.575873859 | 3.245559174 | 0.056099957 |
| Sum: | 17.41288584 | 100 | 100 |
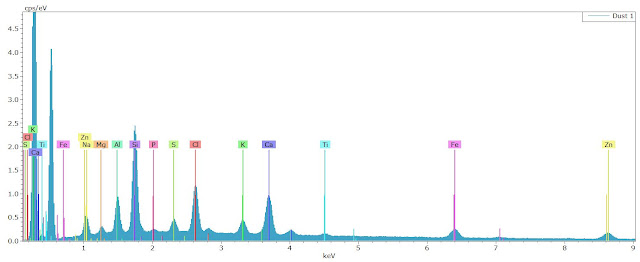
The data shows that there is a significant amount of Silicon, Aluminium, Chlorine and Calcium. The dust samples that were analysed are very similar to each other and most of the times contain very similar elements. This could be a positive result since we are not finding anything different or harmful/toxic. This in general shows that the environment is safe. Few elements that are considered to appear in and out in dust samples are Titanium or Iron.
The data for sample 2 is shown below;
The Raw data;
| Element | AN | series | [wt.%] | [norm. wt.%] | [norm. at.%] | Error in wt.% (1 Sigma) |
| Sodium | 11 | K-series | 1.739025904 | 6.880716516 | 9.84080113 | 0.146489647 |
| Magnesium | 12 | K-series | 0.678332656 | 2.683924777 | 3.630831801 | 0.066275733 |
| Aluminium | 13 | K-series | 2.339211143 | 9.255439329 | 11.27876949 | 0.143731846 |
| Silicon | 14 | K-series | 6.573807913 | 26.01025584 | 30.45046161 | 0.318492847 |
| Phosphorus | 15 | K-series | 0.57566584 | 2.277708137 | 2.417884554 | 0.049822968 |
| Sulfur | 16 | K-series | 1.127623333 | 4.461610649 | 4.57486514 | 0.068051371 |
| Chlorine | 17 | K-series | 3.634143603 | 14.3790336 | 13.33557664 | 0.151203807 |
| Potassium | 19 | K-series | 1.263739512 | 5.000174703 | 4.204929517 | 0.065070355 |
| Calcium | 20 | K-series | 3.89668289 | 15.41780962 | 12.64876297 | 0.140717837 |
| Titanium | 22 | K-series | 0.404680958 | 1.601180838 | 1.099556775 | 0.037751015 |
| Iron | 26 | K-series | 1.375004225 | 5.440410208 | 3.203046288 | 0.061677037 |
| Zinc | 30 | K-series | 1.665989179 | 6.591735772 | 3.314514091 | 0.068676933 |
| Sum: | 25.27390716 | 100 | 100 |
The elements that was detected was similar to the sample one, but a little more amount of silicon than sample 1
Nothing harmful was found which is a good news, especially because these samples are taken from food serving locations. The dust samples were again taken from the top of a cooler, which might explain the presence of Zinc and Iron. The presence of titanium can be explained because of the paint. Titanium is used as a white pigment in paint, fiber coating, fabrics, etc. One of the several reasons for using titanium is because it is very resistant to corrosion.
References
https://www.mineralseducationcoalition.org/minerals/titanium


No comments:
Post a Comment